
What does EpiExposure do?
EpiExposure provides a standardized workflow for
constructing, fitting, interpreting, and simulating distributed
exposure-lag models in plant disease epidemiology.
The package helps users:
- define non-linear exposure-lag structures;
- fit distributed lag non-linear models;
- quantify lag-specific, period-specific, and cumulative effects;
- evaluate complete exposure profiles;
- predict expected disease outcomes;
- simulate alternative exposure scenarios;
- estimate yield and economic losses.
Unlike conventional window-based approaches, EpiExposure
treats the complete environmental profile preceding disease assessment
as the epidemiological exposure unit.
What you will learn. This tutorial shows how to organize longitudinal epidemiological data, define and diagnose an exposure–lag structure, fit a first DLNM, and predict an expected disease outcome from a complete exposure profile.
The EpiExposure workflow
A basic analysis follows six stages:
- organize and inspect complete exposure profiles;
- define the exposure-response and lag-response basis functions;
- evaluate the proposed structure for identifiability and numerical stability;
- collapse each profile into one epidemic-level design row;
- prepare the response and fit the model;
- use the fitted model for interpretation, prediction, or simulation.
This section introduces the basic workflow but stops before detailed effect interpretation. Lag-specific, period-specific, and cumulative effects are covered in the Understanding Effects section
Organizing exposure profiles
EpiExposure expects longitudinal data in which each row
represents one observation within an epidemic profile.
At minimum, the dataset must contain:
- an epidemic identifier, such as
epi_id; - a numeric temporal index, such as
time; - one or more exposure variables;
- one final response associated with each epidemic.
In the example dataset:
-
epi_ididentifies independent epidemic profiles; -
timeorders observations chronologically; -
tmean,rain, andwetnessare environmental exposures; -
yis the final disease response.
The temporal index begins at the earliest observation and ends at the disease assessment:
time 0  → earliest exposure observation → maximum lag
time 85 → disease assessment            → lag 0
Every epidemic must contain the same complete and regularly spaced
exposure profile. With max_lag = 85, each epidemic
requires:
observations for every fitted exposure.
data("epi_data")Inspecting the example dataset
The example contains complete environmental profiles for multiple epidemics.
| epi_id | time | tmean | rain | wetness | y |
|---|---|---|---|---|---|
| 1 | 0 | 21.96 | 0.00 | 8.83 | 0.33 |
| 1 | 1 | 21.47 | 0.00 | 11.86 | 0.33 |
| 1 | 2 | 21.53 | 5.38 | 12.49 | 0.33 |
| 1 | 3 | 21.76 | 14.59 | 12.30 | 0.33 |
| 1 | 4 | 20.83 | 0.00 | 11.41 | 0.33 |
| 1 | 5 | 23.03 | 8.24 | 7.98 | 0.33 |
| 1 | 6 | 23.89 | 4.69 | 10.84 | 0.33 |
| 1 | 7 | 23.14 | 12.30 | 8.58 | 0.33 |
| 1 | 8 | 25.32 | 4.14 | 10.61 | 0.33 |
| 1 | 9 | 25.99 | 1.91 | 14.10 | 0.33 |
Before modeling, verify that every epidemic contains the required number of observations:
For max_lag = 85, the expected result is 86 observations
per epi_id.
Visualizing exposure profiles
Visual inspection can reveal temporal trends, unusual exposure profiles, limited variation, and missing observations.
wetness_plot = epi_data |>
  ggplot(aes(time,wetness, group = epi_id))+
  geom_smooth(se = F, color = "#55A868",linewidth = 0.3)+
  theme_bw()+
  labs(x = "Days after planting the crop",
       y = "Leaf wetness (%)")+
  scale_x_continuous(limits = c(0,85), expand = c(0,0),
                     breaks = pretty(epi_data$time, n = 8))+
  theme(text = element_text(size = 10))


wetness_plot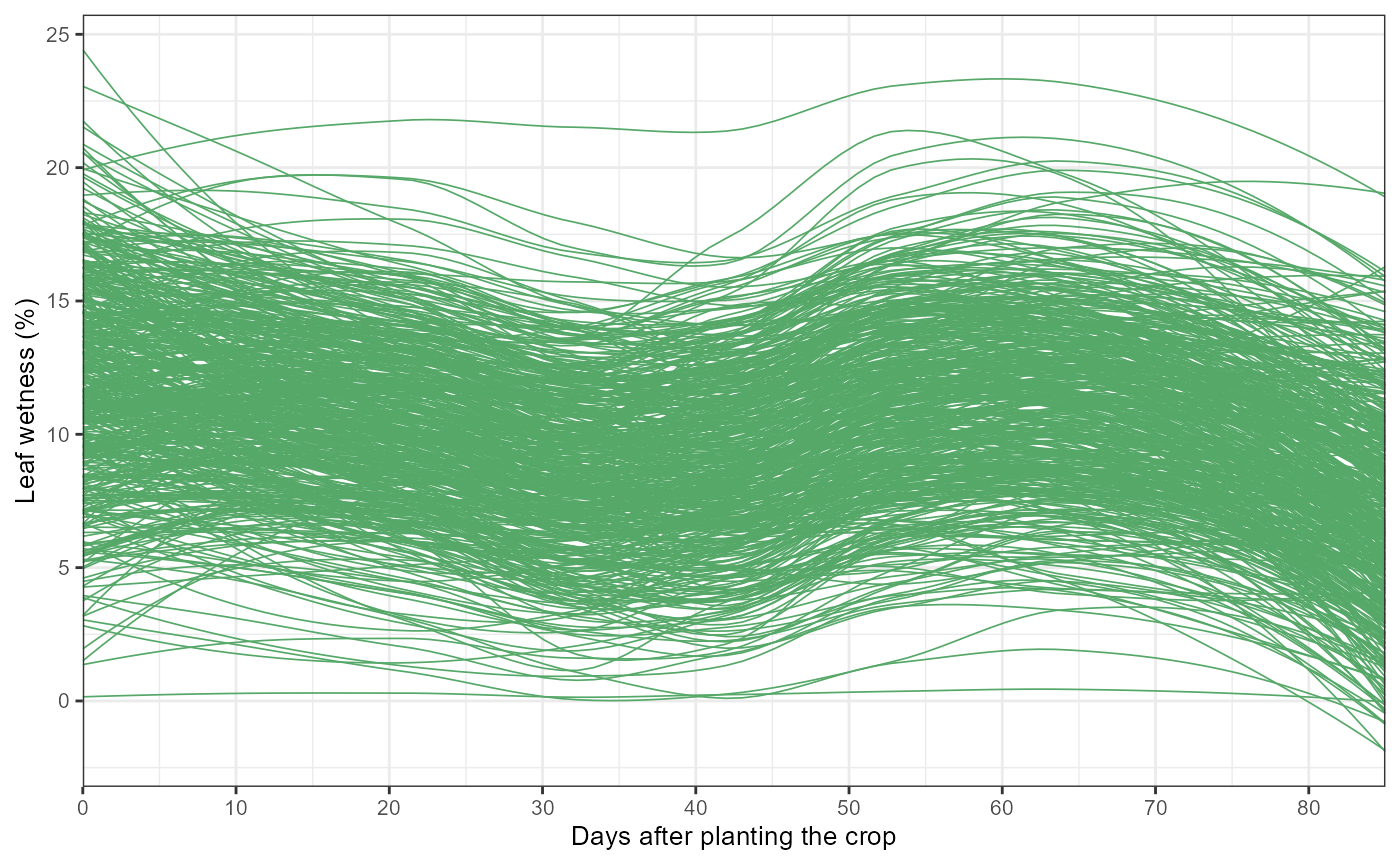
rain_plot = epi_data  |>
  ggplot(aes(time,rain, group = epi_id))+
  geom_smooth(se = F, color = "#4C72B0",linewidth = 0.3)+
  theme_bw()+
  labs(x = "Days after planting the crop",
       y = "Daily precipitation (mm)")+
  scale_x_continuous(limits = c(0,85), expand = c(0,0),
                     breaks = pretty(epi_data$time, n = 8))+
  theme(text = element_text(size = 10))


rain_plot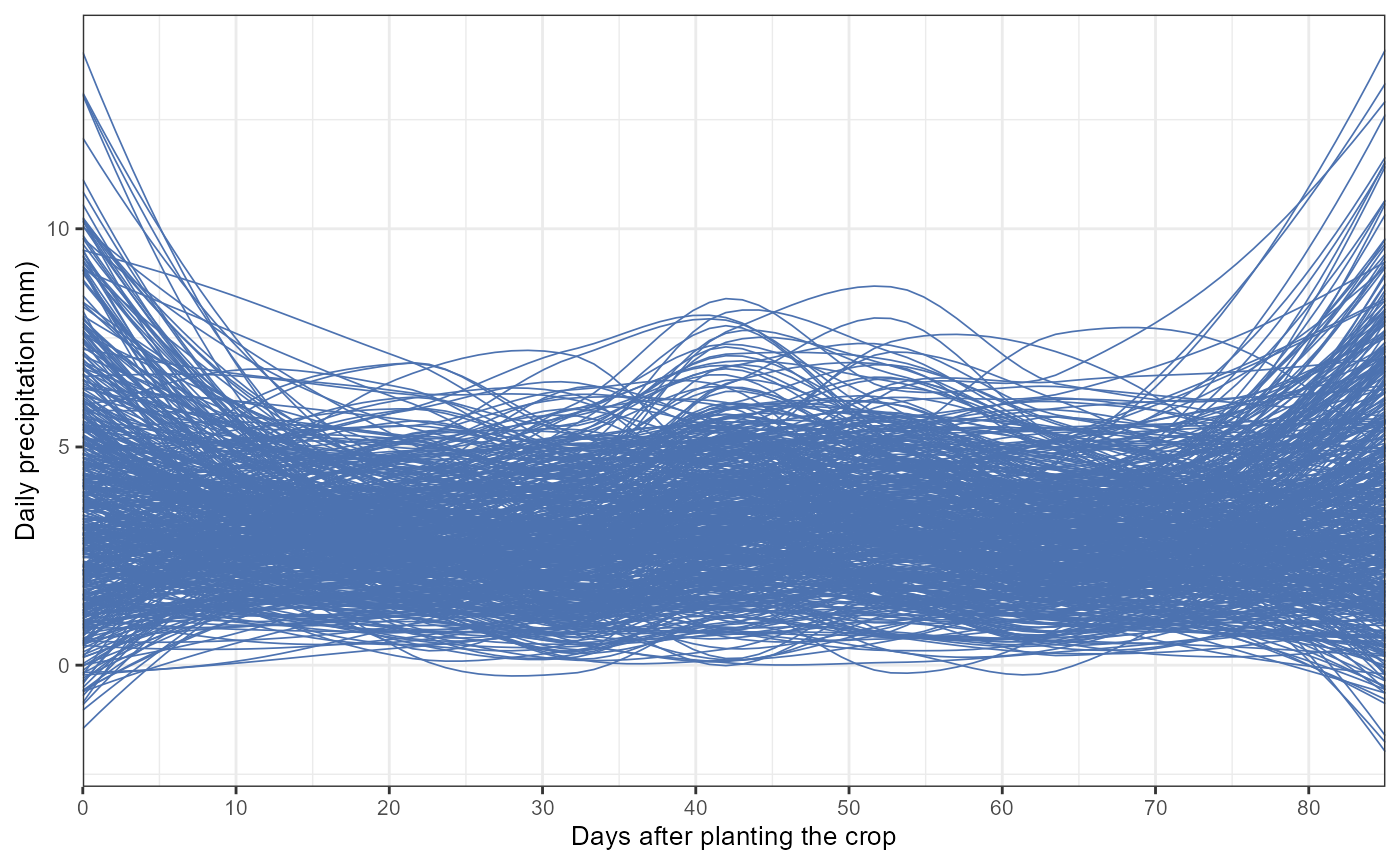
tmean_plot = epi_data |>
ggplot(aes(time,tmean, group = epi_id))+
geom_smooth(se = F, color = "#C44E52",linewidth = 0.3)+
theme_bw()+
labs(x = "Days after planting the crop",
y = "Mean temperature (°C)")+
scale_x_continuous(limits = c(0,85), expand = c(0,0),
breaks = pretty(epi_data$time, n = 8))+
theme(text = element_text(size = 10))
tmean_plot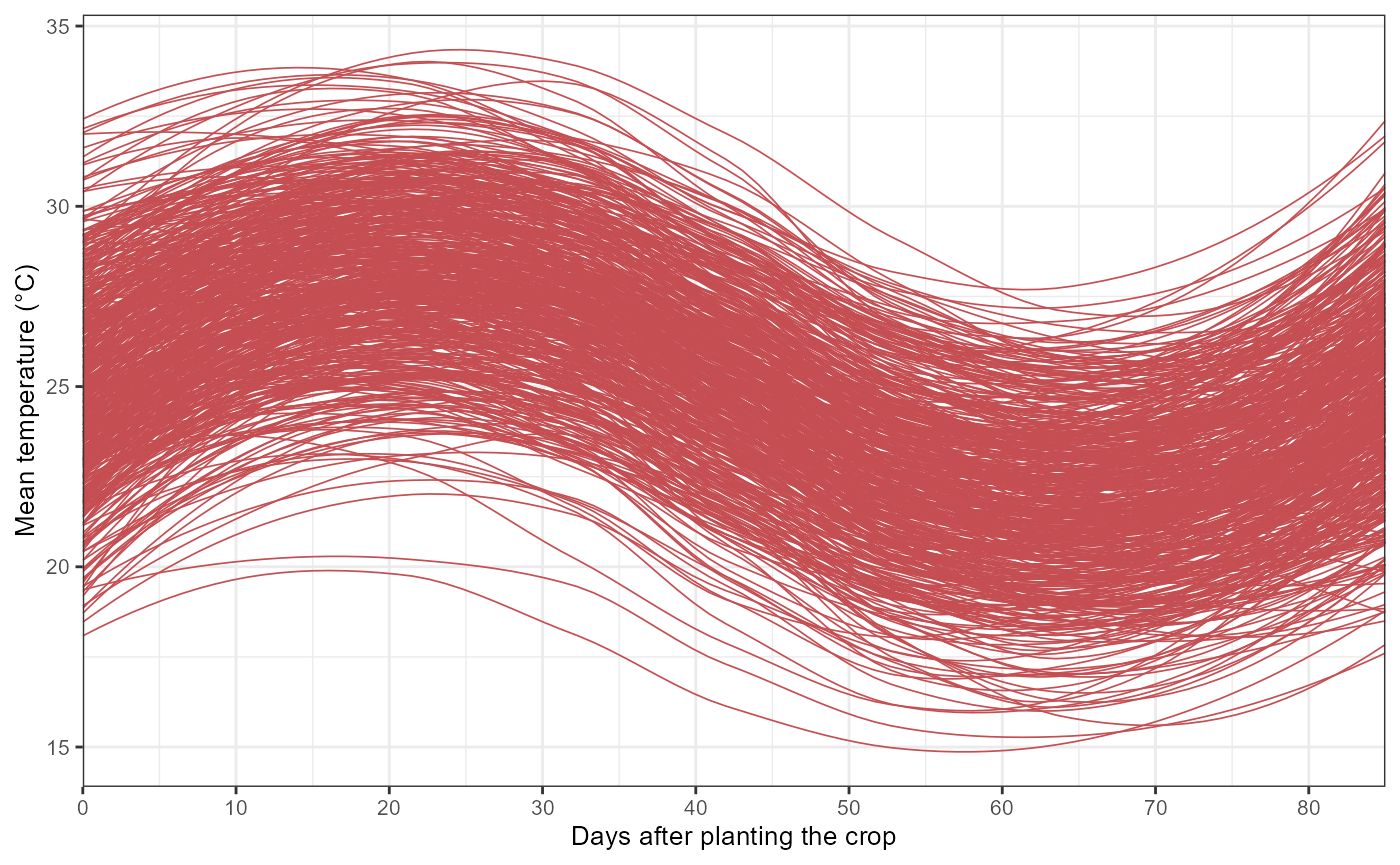 The objective is not to identify exposure effects visually. These plots
only describe the observed profiles. Effect estimation requires the DLNM
model.
Defining exposure-lag structures
The first modeling step is to define the non-linear exposure-response and lag-response basis functions.
cb <- define_exposures(
  data = epi_data,
  vars = c(
    "tmean",
    "rain",
    "wetness"
  ),
  max_lag = 85,
  df_var = 3,
  df_lag = 2
)
Here:
-
varsidentifies the exposures included in the DLNM; -
max_lag = 85defines the retrospective lag window; -
df_var = 3controls exposure-response flexibility; -
df_lag = 2controls lag-response flexibility.
The resulting object stores the fitted basis definitions required for model construction and downstream prediction.
Exposure variables only. Coordinates, treatment
groups, blocks, years, and other identifiers should not be included in
vars. They can be preserved separately by
build_design() when needed for random or spatial
effects.
Checking identifiability and numerical stability
Before fitting the model, the proposed exposure–lag structure should be evaluated for identifiability and numerical stability. Increasing the number of exposures or the flexibility of the exposure and lag bases increases the number of cross-basis predictors and may produce redundant, rank-deficient, or poorly conditioned designs.
check_identifiability() reconstructs the same
epidemic-level cross-basis design used by the EpiExposure fitting
workflow. The function evaluates the combined numerical rank, scaled
condition number, near-zero-variance columns, between-exposure
cross-basis correlations, supplementary variance inflation factors, and
the number of epidemics relative to design complexity.
identifiability <- check_identifiability(
  data = epi_data,
  vars = c(
    "tmean",
    "rain",
    "wetness"
  ),
  max_lag = 85,
  df_var = 3,
  df_lag = 2
)
The printed output classifies the proposed design as
"ok", "warning", or "problem".
The identifiable field indicates whether the combined
epidemic-level design has full numerical rank, whereas
numerically_stable additionally considers severe
conditioning, near-zero-variance columns, and whether the available
epidemics can support the number of design columns.
| n_epidemics_total | n_epidemics_complete | n_epidemics_excluded | n_exposures | max_lag | history_length | crossbasis_columns | design_columns | rank | full_rank | rank_ratio | design_residual_df_proxy | condition_number_scaled | min_singular_value_scaled | max_singular_value_scaled | max_abs_crossbasis_correlation | median_abs_crossbasis_correlation | max_vif | median_vif | near_zero_variance_columns | epidemics_per_design_column | time_step |
|---|---|---|---|---|---|---|---|---|---|---|---|---|---|---|---|---|---|---|---|---|---|
| 520 | 520 | 0 | 3 | 85 | 86 | 18 | 19 | 19 | TRUE | 1 | 501 | 18.8499 | 2.3269 | 43.8625 | 0.9177 | 0.0444 | 42.7938 | 5.2346 | 0 | 27.3684 | 1 |
| variable | n_unique_exposure | exposure_missing_n | exposure_missing_percent | history_length | max_lag | basis_columns | rank | full_rank | rank_ratio | condition_number_scaled | max_abs_within_basis_correlation | near_zero_variance_columns |
|---|---|---|---|---|---|---|---|---|---|---|---|---|
| tmean | 44611 | 0 | 0 | 86 | 85 | 6 | 6 | TRUE | 1 | 18.4765 | 0.8936 | 0 |
| rain | 15907 | 0 | 0 | 86 | 85 | 6 | 6 | TRUE | 1 | 7.2265 | 0.9177 | 0 |
| wetness | 44319 | 0 | 0 | 86 | 85 | 6 | 6 | TRUE | 1 | 4.7469 | 0.8108 | 0 |
| x |
|---|
6 cross-basis column(s) have VIF >= 10. Treat this
as supplementary because spline-basis columns are correlated by
construction. High VIF alone does not change status;
prioritize the combined rank and scaled condition number. |
A "warning" does not automatically invalidate the
proposed structure. It indicates that the reported diagnostics should be
examined before model fitting. A "problem" indicates rank
deficiency or severe numerical instability and generally supports
simplifying the candidate structure, for example by reducing
df_var or df_lag, reconsidering redundant
exposures, or increasing the number of independent epidemics.
The diagnostic thresholds are interpretive heuristics rather than universal inferential rules. In particular, high correlations or VIFs among individual spline columns may arise from the basis construction itself. The combined numerical rank and scaled condition number should therefore receive greater emphasis than any isolated column-level diagnostic.
Building the epidemic-level design
build_design() transforms each complete longitudinal
profile into one epidemic-level row containing the cross-basis
predictors.
dat <- build_design(
  data = epi_data,
  cb_templates = cb)
The original exposure columns are represented by canonical cross-basis columns such as:
cb_tmean_1, cb_tmean_2, ...
cb_rain_1, cb_rain_2, ...
cb_wetness_1, cb_wetness_2, ...
The coefficients of these columns should not be interpreted individually. Together, they reconstruct the non-linear exposure-lag-response association.
Inspect the resulting design:
| epi_id | cb_tmean_1 | cb_tmean_2 | cb_tmean_3 | cb_tmean_4 | cb_tmean_5 | cb_tmean_6 | cb_rain_1 | cb_rain_2 | cb_rain_3 | cb_rain_4 | cb_rain_5 | cb_rain_6 | cb_wetness_1 | cb_wetness_2 | cb_wetness_3 | cb_wetness_4 | cb_wetness_5 | cb_wetness_6 | y |
|---|---|---|---|---|---|---|---|---|---|---|---|---|---|---|---|---|---|---|---|
| 1 | 5.765 | 5.545 | 21.801 | 0.515 | -11.524 | 0.481 | 0.657 | -0.839 | 16.376 | 2.138 | -6.935 | -1.236 | 4.869 | 0.929 | 23.264 | 1.555 | -12.855 | -0.774 | 0.330 |
| 2 | 5.838 | 7.070 | 20.565 | 0.978 | -10.660 | 0.423 | 1.974 | 0.311 | 14.655 | 1.071 | -4.947 | 0.128 | -2.937 | 0.300 | 21.177 | 2.585 | -12.003 | -1.463 | 0.071 |
| 3 | 6.950 | 4.678 | 21.307 | 1.259 | -10.660 | 0.061 | 1.180 | 0.384 | 5.205 | 0.195 | -1.241 | 0.248 | 12.899 | 1.294 | 20.370 | 1.219 | -8.147 | 0.539 | 0.190 |
| 4 | 7.156 | 8.038 | 20.828 | 0.221 | -10.864 | 0.944 | 1.550 | -0.018 | 7.855 | -1.201 | -2.977 | 0.685 | -1.550 | 1.641 | 17.718 | 2.848 | -9.977 | -1.521 | 0.036 |
| 5 | 6.736 | 6.837 | 20.943 | -0.178 | -10.292 | 1.655 | 0.911 | -0.435 | 7.176 | -1.187 | -2.442 | 0.382 | 1.169 | -0.367 | 21.088 | 1.808 | -11.570 | -0.933 | 0.117 |
| 6 | 6.861 | 5.114 | 21.562 | 1.274 | -11.556 | -0.268 | 1.562 | 0.105 | 10.663 | 1.816 | -3.284 | -0.974 | 3.093 | 4.926 | 21.770 | 1.654 | -11.816 | -0.419 | 0.126 |
Preparing the disease response
The response must be prepared for the distribution used in the model.
dat <- prepare_response(
  data = dat,
  response = "y",
  family = "beta"
)
The Beta family is appropriate when the response is a continuous proportion strictly between 0 and 1.
Other supported families should be selected according to the response scale, for example:
-
binomialfor a Bernoulli response coded as 0 or 1; -
poissonfor non-negative counts; -
negative_binomialfor overdispersed counts; -
gammafor positive continuous responses; -
gaussianfor approximately continuous, unbounded responses.
For details on available modeling engines, supported response distributions, engine-specific requirements, and Bayesian and frequentist workflows, see the Advanced Topics section.
Fitting the first DLNM
The prepared design can now be fitted with one of the supported modeling engines.
fit <- fit_epidlnm(
  data = dat,
  model_engine = "glmmTMB",
  family = "beta",
  random_effect = NULL,
  epiexposure_spec = attr(
    cb,
    "spec"
  )
)
This model estimates a population-level association between the complete profiles of temperature, rainfall, and leaf wetness and the final disease response.
summary(fit)
#>  Family: beta  ( logit )
#> Formula:
#> y_model ~ 1 + cb_tmean_1 + cb_tmean_2 + cb_tmean_3 + cb_tmean_4 +
#>     cb_tmean_5 + cb_tmean_6 + cb_rain_1 + cb_rain_2 + cb_rain_3 +
#>     cb_rain_4 + cb_rain_5 + cb_rain_6 + cb_wetness_1 + cb_wetness_2 +
#>     cb_wetness_3 + cb_wetness_4 + cb_wetness_5 + cb_wetness_6
#> Data: dat
#>
#>       AIC       BIC    logLik -2*log(L)  df.resid
#>   -1375.4   -1290.4     707.7   -1415.4       500
#>
#>
#> Dispersion parameter for beta family (): 29.7
#>
#> Conditional model:
#>               Estimate Std. Error z value Pr(>|z|)
#> (Intercept)  -3.475218   0.947903  -3.666 0.000246 ***
#> cb_tmean_1    0.118230   0.014595   8.101 5.46e-16 ***
#> cb_tmean_2   -0.207029   0.027422  -7.550 4.36e-14 ***
#> cb_tmean_3   -0.062001   0.039492  -1.570 0.116421
#> cb_tmean_4   -0.324065   0.100821  -3.214 0.001308 **
#> cb_tmean_5   -0.091731   0.031843  -2.881 0.003968 **
#> cb_tmean_6    0.016912   0.054302   0.311 0.755467
#> cb_rain_1     0.217255   0.039357   5.520 3.39e-08 ***
#> cb_rain_2    -0.357518   0.050983  -7.013 2.34e-12 ***
#> cb_rain_3     0.239871   0.025436   9.431  < 2e-16 ***
#> cb_rain_4    -0.273807   0.039372  -6.954 3.54e-12 ***
#> cb_rain_5     0.160458   0.057216   2.804 0.005041 **
#> cb_rain_6    -0.034856   0.080037  -0.435 0.663201
#> cb_wetness_1  0.110230   0.004315  25.545  < 2e-16 ***
#> cb_wetness_2 -0.037250   0.016298  -2.285 0.022284 *
#> cb_wetness_3  0.074292   0.015282   4.861 1.17e-06 ***
#> cb_wetness_4 -0.039607   0.048578  -0.815 0.414877
#> cb_wetness_5  0.090457   0.009308   9.718  < 2e-16 ***
#> cb_wetness_6 -0.055629   0.029369  -1.894 0.058207 .
#> ---
#> Signif. codes:  0 '***' 0.001 '**' 0.01 '*' 0.05 '.' 0.1 ' ' 1
The individual cb_* coefficients are components of the
cross-basis expansion. Their signs and
-values
should not be interpreted as isolated epidemiological effects.
The fitted exposure-lag surface must instead be reconstructed into quantities such as lag-specific, period-specific, and cumulative effects. That process is introduced in the Understanding Effects section
Predicting one complete exposure profile
A fitted model can also estimate the expected disease outcome associated with a complete hypothetical exposure profile.
In this example, a constant environmental scenario is evaluated over
an 86-day exposure window. Daily mean temperature (tmean)
is fixed at 25°C, daily rainfall (rain) at 5 mm, and daily
leaf wetness duration (wetness) at 15 hours. The model
combines the lagged contributions of all daily exposures to estimate the
expected disease outcome for this exposure profile.
prediction <- predict_outcomes(
  fit = fit,
  profiles = list(
    tmean = rep(
      25,
      86
    ),
    rain = rep(
      5,
      86
    ),
    wetness = rep(
      15,
      86
    )
  )
)
prediction
#>   prediction
#> 1  0.9777891
Each exposure profile contains exactly 86 chronologically ordered observations, matching:
max_lag + 1The resulting prediction represents the expected population-level disease response for the complete exposure profile. It is not a newly simulated observation.
Where to go next
You have now completed the basic EpiExposure
workflow:
- loaded longitudinal epidemic data;
- inspected complete exposure profiles;
- defined the exposure–lag basis;
- evaluated its identifiability and numerical stability;
- constructed the epidemic-level design;
- prepared the response;
- fitted a DLNM;
- predicted an expected disease outcome.
Continue with the Understanding Effects section to learn how to:
- interpret lag-specific effects;
- define epidemiological periods;
- calculate cumulative effects;
- select meaningful reference exposures;
- visualize uncertainty across the exposure-lag surface.
More advanced topics, including alternative modeling engines, random effects, spatial Matérn structures, and Bayesian estimation, are covered in the Advanced Topics section. Additional comparisons among candidate exposure–lag structures are discussed in the Sensitivity and Decision section.